
What Are Core Web Vitals?
Core Web Vitals are a set of specific metrics that Google uses to measure the real-world user experience of a webpage. They focus on three things that matter most to people browsing the internet: how fast a page loads, how quickly it responds when you try to interact with it, and how stable the layout is while it’s loading. Instead of relying on vague ideas like “this site feels slow,” Core Web Vitals give developers concrete numbers to measure and improve.
These metrics were introduced by Google as part of its broader Web Vitals initiative, and they’ve become a standard way for developers, marketers, and business owners to evaluate site performance. Because Google also uses these metrics as a ranking signal for search results, Core Web Vitals matter not just for user satisfaction but for SEO as well.
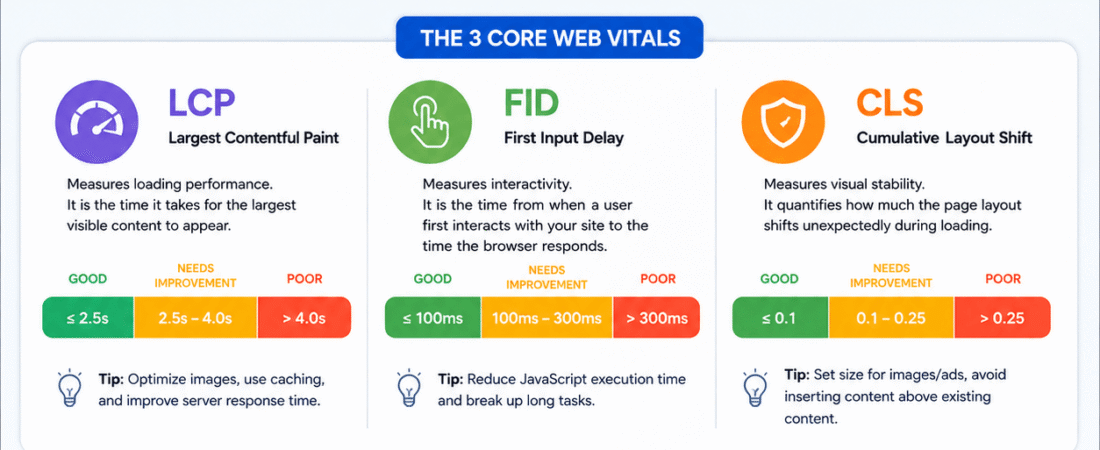
There are currently three Core Web Vitals: Largest Contentful Paint (LCP), Interaction to Next Paint (INP), and Cumulative Layout Shift (CLS). Let’s go through each one in plain language.
1. Largest Contentful Paint (LCP) — How Fast Does the Page Load?
Largest Contentful Paint measures loading performance. Specifically, it tracks how long it takes for the largest visible piece of content on the screen — like a hero image, a video thumbnail, or a large block of text — to fully render.
Think about it this way: when you click a link and land on a new page, you’re not really satisfied until you can see the main content. A blank white screen or a page full of placeholder boxes feels broken, even if some parts of the page have technically loaded. LCP tries to capture the moment when the page starts to feel “usable” and “real” to the person viewing it.
What’s a good score?
- Good: 2.5 seconds or less
- Needs improvement: 2.5 to 4 seconds
- Poor: more than 4 seconds
Common causes of poor LCP:
- Slow server response times
- Render-blocking JavaScript and CSS
- Large, unoptimized images
- Slow-loading web fonts
- Client-side rendering that delays content display
How to improve it:
- Compress and properly size images (using modern formats like WebP or AVIF)
- Use a content delivery network (CDN) to serve assets faster
- Minimize CSS and JavaScript that blocks rendering
- Preload key resources, like your hero image or main font
- Improve server response time (upgrade hosting, use caching)
2. Interaction to Next Paint (INP) — How Responsive Is the Page?
Interaction to Next Paint measures interactivity — essentially, how quickly the page responds when someone clicks a button, taps a menu, or types into a form field. It replaced an older metric called First Input Delay (FID) in March 2024 because INP gives a more complete picture of responsiveness throughout the entire time someone is on a page, not just the very first interaction.
Here’s why this matters: imagine clicking an “Add to Cart” button and then just… waiting. Nothing happens. You click again. Still nothing. Then suddenly the page catches up and processes both clicks at once, adding two items instead of one. That frustrating lag is exactly what INP is designed to catch and quantify.
What’s a good score?
- Good: 200 milliseconds or less
- Needs improvement: 200 to 500 milliseconds
- Poor: more than 500 milliseconds
Common causes of poor INP:
- Heavy JavaScript execution that blocks the main thread
- Large, complex DOM structures
- Inefficient event handlers
- Third-party scripts (ads, analytics, chat widgets) hogging processing power
How to improve it:
- Break up long-running JavaScript tasks into smaller chunks
- Reduce or defer non-essential JavaScript, especially third-party scripts
- Use browser APIs like
requestIdleCallbackto schedule non-urgent work - Avoid unnecessary re-renders in frameworks like React or Vue
- Simplify the DOM where possible to reduce the browser’s workload
3. Cumulative Layout Shift (CLS) — Is the Page Visually Stable?
Cumulative Layout Shift measures visual stability. It quantifies how much content unexpectedly moves around while a page is loading or as someone interacts with it. You’ve probably experienced this: you’re about to tap a button, and right before your finger lands, an ad loads above it and pushes everything down — so you end up clicking the wrong thing entirely.
CLS calculates a score based on how much visible content shifts and how far it moves. Unlike LCP and INP, it’s not measured in time — it’s a unitless score based on a formula involving the impact and distance of layout shifts.
What’s a good score?
- Good: 0.1 or less
- Needs improvement: 0.1 to 0.25
- Poor: more than 0.25
Common causes of poor CLS:
- Images or videos without defined width and height attributes
- Ads, embeds, or iframes that load without reserved space
- Web fonts that cause a “flash of unstyled text” (FOUT) and reflow content
- Content that’s dynamically injected above existing content
How to improve it:
- Always specify width and height (or aspect-ratio) for images and video elements
- Reserve space for ads and embeds before they load
- Use
font-display: optionalor preload fonts to reduce font-swapping shifts - Avoid inserting new content above existing content unless triggered by user interaction
Why Core Web Vitals Matter
User experience. At the core (pun intended), these metrics exist because slow, janky, unstable websites frustrate people. Studies consistently show that as page load times increase, bounce rates go up and conversions go down. A faster, more stable, more responsive site simply keeps people around longer.
SEO impact. Google has confirmed that Core Web Vitals are part of its page experience signals used in search ranking. While content relevance and quality still matter far more, Core Web Vitals can be a tiebreaker between otherwise similar pages — and poor scores can hold back an otherwise well-optimized page.
Business outcomes. Faster, more stable sites tend to see better engagement metrics, lower cart abandonment on e-commerce sites, and improved conversion rates. Many companies have published case studies showing measurable revenue increases after improving their Core Web Vitals scores.
How to Measure Core Web Vitals
There are two categories of tools:
Field data (real user data): This comes from actual visitors using your site in real-world conditions. Google’s Chrome User Experience Report (CrUX) collects this data, and you can view it through:
- Google Search Console (Core Web Vitals report)
- PageSpeed Insights (shows field data when available)
- The Chrome UX Report API
Lab data (simulated testing): This comes from controlled tests run in a simulated environment, useful during development. Tools include:
- Lighthouse (built into Chrome DevTools)
- PageSpeed Insights (lab data section)
- WebPageTest
Field data reflects what real visitors experience and is what Google actually uses for ranking purposes. Lab data is more useful for debugging and testing changes before they go live, since it’s consistent and repeatable.
A Few Practical Tips to Wrap Up
- Start by checking your current scores in Google Search Console or PageSpeed Insights — you can’t improve what you haven’t measured.
- Prioritize LCP first if your scores are poor across the board, since a slow-loading page affects everything downstream.
- Don’t chase perfect scores at the expense of usability — Core Web Vitals are a guide, not the entire goal.
- Re-test after every major change, since third-party scripts, new features, or design updates can quietly reintroduce performance problems.
- Remember that mobile performance is usually worse than desktop, since phones have less processing power and often slower connections — test on both.
Core Web Vitals boil down to three simple questions: Does the page load fast? Does it respond quickly when I interact with it? Does it stay visually stable while I use it? Getting good answers to all three creates a website that feels fast, trustworthy, and pleasant to use — which benefits everyone from casual visitors to the business behind the site.